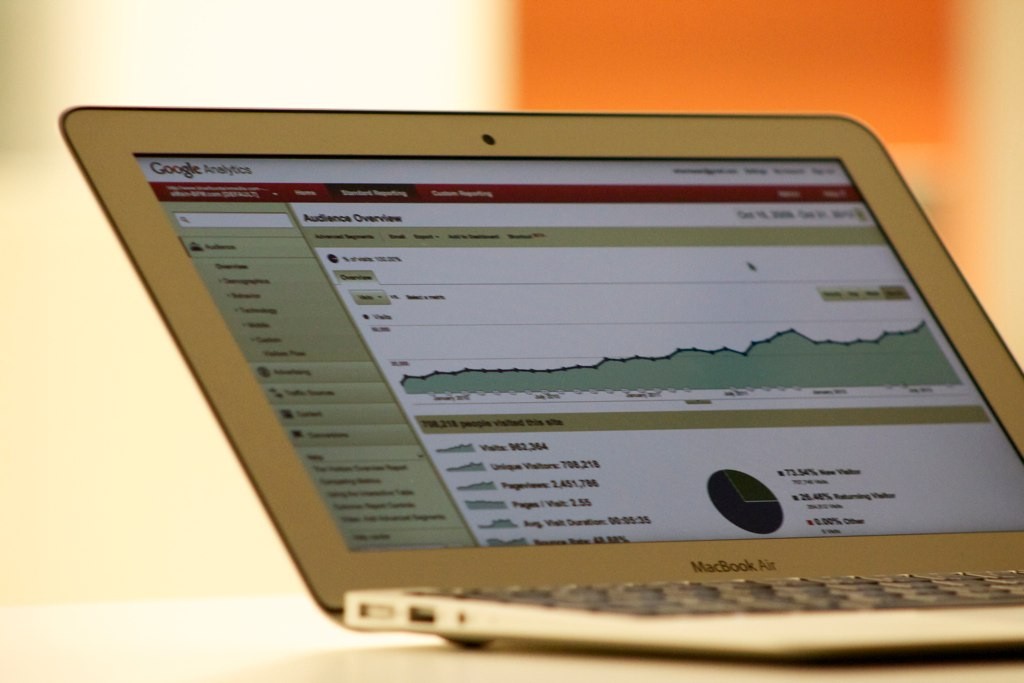
At our second Marketers’ Masterclass we were joined by Brian Tait, Founder and Director of Aillum Limited. This practical, hands-on session provided an overview of some of the more advanced, and often under used, features and tools available within Google Analytics. Brian took participants through a range of functions that can improve data collection and analysis, and ultimately turn customer insights into actions. Here we share just some of our key learnings from the day:
Keep your data clean:
It’s important to filter out your own IP address and any Spam Traffic. This ensures that your analytics are an accurate reflection of your website’s reach and impact. If you don’t you’ll be measuring irrelevant visits to your site and important stats, such as Bounce Rates and Conversions, will become skewed.
Make it easier for yourself:
Google Analytics has lots of features that make it easier for you to find, and make sense of, data that’s relevant to you. Dashboards, for example, provide a single page overview of your key reports so you can quickly visualise the data. They’re straight-forward to create and customisable so you can set them up for what matters most to you.
Annotations are another simple way of ensuring your data is easily understandable. This function allows you to mark notes on your analytics showing when important events took place, such as an email campaign or a website outage. This means that when you look back over time you’ll be able to attribute any spikes or dips in your traffic to those specific events.
Dig into your data:
Within Google Analytics you can also drill-down further to get more detailed analysis. Secondary Dimensions, for instance, are a simple to use filter that instantly puts more context on your data. You can also segment your data to isolate and compare different users, or set up custom reports from scratch to get a greater breakdown of data. There’s a wealth of detailed audience information available once you know how to find it.
Do more with your data:
There’s not much point collecting and analysing all these figures if you don’t then use them to inform your marketing strategy. There are lots of functions within Google Analytics that can help you with this. You can set-up and track specific events, goals or transactions, allowing you to measure website engagement in relation to your business objectives. You can even assign monetary value to your goals giving you a more tangible way of measuring changes and improvements on your site. By tracking interactions in this way you will identify the high value content on your website, meaning you can make informed decisions about how you spend your time.
Brian emphasised that whilst the amount of information available on Google Analytics might seem overwhelming at first, it’s worth pursuing as the possibilities are endless!
If you would like support with your website tracking, or are looking to develop your website and don’t know where to start, get in touch.
Main image credit: Google Analytic on a computer screen by Blue Fountain Media (CC BY 2.0)